![[Photo of the Author]](../../common/images/RalfWieland.jpg)
original in de Ralf Wieland
de to en Orla Shanaghy
I use Linux (since 0.99pl12) to program environmental simulations, neural nets, and fuzzy systems. I'm also interested in electronics and hardware and I use Linux in these areas too.
The immigration and integration of foreigners in our country is a favourite discussion point among our politicians. Companies base their product profiles on demographic development. I recently read that pensioners will soon make up the majority of car buyers in Germany. The health system, pension system etc. all depend on how the population develops.
A lot of research is done into this subject. In-depth studies are published. Despite this, most people are largely ignorant of the processes behind demographic development. This article deals less with political and scientific exactitude, however, and more with our own experiments. Why should we not be able to take a look, even if a somewhat playful one, at the population in 50 or 100 years? What happens when people leave the country, and what happens when others arrive? To allow us to experiment with the possibilities, I developed a little QT program.
Most people are bound to have wondered at some point where the 'population pyramids' that you see in the newspapers actually come from - you know, the ones that show, for example, what the population will be like in 50 years. What information are these diagrams based on?
If you think about it, you will realise that it all depends on the number of children born, the number of people who die, and the rate of movement of people into and out of the geographical area in question; in other words, migration, which is divided into immigration and emigration.
Let's start with the first thing you need to know to construct a population diagram: the birth rate. Every year, a certain number of babies are born. The birth-rate is the average number of children a woman has during her lifetime. This rate differs from country to country and depends on a number of factors such as culture, economic situation, education, and traditions. In Germany, the rate is ca. 1.3 children per woman.
Some countries have a more "pro-children" attitude than others, and in other countries, children may be partly regarded as a kind of insurance for old age. For our purposes, the birth rate is a starting-point for the program, which can be set to between 0 and 10 children per woman. This means we can adjust the birth rate in the program to suit various scenarios.
The number of children born does not depend on the birth rate only, but also on the number of women of childbearing age. In the model, the number of women of childbearing age (for the purposes of the program, ages 15 - 45) is simply added up and multiplied by the birth-rate. To calculate the number of children born per year, this number is then divided by 45-15=30. This is based on the assumption that the average woman will, in her lifetime, have the number of children specified by the birth-rate. Some of you may wonder whether the birth-rate is really accurate, as, after all, one woman may have 7 children, while another may have none. This is a question of statistics and is explained in the relevant literature. In our program, we are less concerned with exact statistics and more with the potential for experimentation - for example, about the question of what would happen, if it became fashionable in Germany to have more than three children per family?
Naturally, anywhere where children are being born, people are also dying. The death rate is similar to the birth rate, except that it applies to the whole population, not just women. (Of course, men do also play a role in the birth-rate, but this is not the place for that discussion ;-)). The age of the individual is of course a major factor in the death rate; statistically, older people are more likely to die than younger people. In Germany, there is an official death rate table, which is used by insurance companies to calculate their life insurance premiums. Our program is based on the data in this death rate table. You will have to adjust this data for other countries.
Note that in industrialised countries, the rate should be based only on age and not on additional factors such as social class. However, as a Mexican friend explained to me, this cannot be universally applied. In our program, the death rate is based on age only, so if anyone wants social factors to be included, they will have to extend the program themselves. Maybe someone would like to do this?
And finally, migration should also be taken into account. Clearly, processes of migration have always played an important role. For example, in previous centuries, the rural population tended to migrate to the cities. This did not represent a serious problem, as the high birth-rate cancelled out the effects of the population loss. These days, processes of migration are different. However, rural depopulation is still a significant phenomenon in modern Germany, and will cause the increasing isolation of some regions.
The whole process is an autocatalytic one that is reinforced by the breakdown of social and cultural facilities. It is not worth having facilities for children in an area if few children live there. At the same time, not many people will want to move to an area where there are no facilities for children. The same goes for cultural facilities. Without going too much into detail, it should be clear that migration can have many and varied causes. The most important thing to realise for the purposes of the program is that the age structure of people who leave an area is usually different from that of people who move to that area. To reflect this in the program, you can adapt the "Distribution" field in the source code "./demogra/demogra1.cpp" to your own purposes. This should not be necessary for initial experiments, though.
The fields "Immigration" and "Emigration" are for inputting this data. These fields take absolute values. So, if 10,000 people a year move to an area, enter the figure 10,000 in the Immigration field.
Last but not least, we all get a year older every year. To take this into account, the year loop makes someone who was 40 years old, 41 years old. The "Step" input field allows you to move forward by several years at once - for example, if you specify 10, the model will show development over a ten-year period in one step.
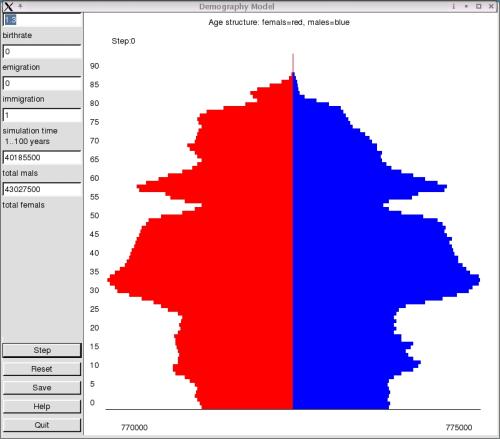
Let's take a first look at the user interface of the
program:
The input fields described above are located on the left-hand side of the screen. The combined total of men and women is output in the corresponding field in this part of the screen after every step. These fields are for output only. Similarly, the entire graphic area is for visualisation purposes only. The buttons in the lower left-hand part of the screen are for controlling the simulation. The "Step" button executes a step in the simulation. "Reset" resets everything to its initial state. The current status of the model can be saved to the file "simulation.dat". This file contains the number of men and women of a particular age as reflected in the model at the time of saving. It is possible to carry out a separate analysis on this file. The "Help" and "Quit" buttons are self-explanatory.
The lower part of the graphic output field displays the maximum number of men and women in all age groups as a guide value. Note that the size of the bars is in relation to this maximum figure. Maybe this isn't the best solution, but I can't think of any alternatives at the moment. Does anyone else have any ideas on this?
Otherwise, the simulation should be self-explanatory. If the input is extreme in one way or another - for example, if the number of emigrants is very high - gaps will appear in the age pyramid. This kind of result is unlikely in practice, so the input should be appropriate. On the other hand, maybe pathological phenomena, such as AIDS, could really have this effect? It might be that one age group in an area is decimated by AIDS, and the remaining population moves away, leaving the area desolate?
The program is licensed under the GPL. The TrollTech license applies in the case of QT.
Installation is very simple. First, download the demographic model (see references). Use tar -zxvf demographie-0.2.tar.gz to unpack the "demographie-0.2.tar.gz" file. Start the installation from the newly-created directory using make or a previous qmake. Prerequisites are QT3 and the gcc. The program has been successfully tested under SuSE 8.0 and SuSE 8.1, and should also work with other distributions.
To start the program, enter "./demographie" in the command line. Just make sure that the "demo.csv" is stored in the same directory. This file contains the year numbers, the figures for female and males, and the death rates for females and males, all as comma-separated values. If you want to adjust the data to suit a particular region, you do so in this file. In our example, a newspaper was the source for the figures for Germany. They may not be completely accurate, but are adequate for our experimental purposes.
The program came into being as part of a regional simulation system. This system was designed to answer questions such as, how will the population of a well-defined geographical region (the rural area north of Berlin) develop? In particular, the system examined the arrival of young families to areas near Berlin and the departure of young people to the Western Bundesländer. The results showed great differences from region to region. There are some areas whose population is growing and others whose population is decreasing. Some areas, especially the more geographically remote ones, are becoming more and more sparsely populated. A notable effect in this is the autocatalytic process referred to above.
We have to be careful with predictions like this, however, because not all data that is relevant in such a process is included in the evaluation. For example, the phenomenon of teleworking means that distance from Berlin is no longer as important as it might seem. Programs that promote particular areas as good industrial locations can also create a different scenario. Therefore, the models simply represent a continuation of the current status and are for orientation only.
If we want to apply the program to other areas of the world, we have to consider other processes again. It would be interesting to use the program to examine a totally different area, for example, rural regions of Mexico. Lots of new ideas are required here. Maybe someone would like to look into this in greater detail, or adapt the model to other regions? I would be glad to hear from anyone on this subject.
I would like to extend heartfelt thanks to the Linux community, who have developed such a fantastic system. I also thank the company Troll Tech for the brilliant QT and for making it available under Linux. And of course special thanks are due to the FSF for the many tools, especially gcc, without which the work presented in this paper would not have been possible.
Happy hacking!